SeaTable 5.3 introduced the report design plugin. The new plugin supports the generation of PDF reports from your SeaTable data with a variety of elements including single records, tables and diagrams.
The report design plugin is currently in beta phase. Your feedback is very welcome! Please post it underneath!
I am still in the progress of testing, I will keep posting my findings here.
When adding a new element to a document and deleting it (with no other elements present), the document becomes softlocked. I cannot add new elements or edit/remove typed text. I haven’t fully tested with other elements present.
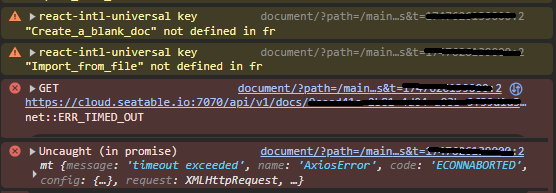
You don’t have to open any ports if you use cloud.seatable.io. Probably your company blocks websocket connections on ports other than 443? This is only a guess…
Hi guys,
I am trying to set up a very simple report including just a SeaTable Table, that is filtered down to maybe 50 rows and two columns. So nothing crazy.
First off: It will not let me adjust the width of the columns. Since there are only two I want to expand them to fill the whole width of the page. But it will not work.
Secondly: If I download the PDF of this report, I get an empty page with just “Table_not_exist”.
Hi there, thank you for the promising report design plugin and your ongoing expansion of the SeaTable Cloud Software, which my non-profit association uses with great success.
Here is some feedback on, and some wishes for the further development of the report design plugin
It is possible for me to create almost what I want, which is a multi-page report of an entry in my “Workshop” table, that I can subsequently download as pdf (unfortunately it is as of yet not possible to download pdf’s of pages of the universal app or the statistics module)
What I cannot do (or at least haven’t figured out how) is, to
Write a heading for my report which references data from the current workshop entry such as: “Feedback for the Workshop {workshop.Name} on the {workshop.Date} at {workshop.location}
Display the linked feedbacks for the workshop statistically. (since the charts are linked to an independent table and then filtered, i cannot use the charts to directly display the feedbacks of the current entry that the report design displays. This would be amazing, because then I wouldn’t have to filter each feedback-chart when I want a report on a different workshop but I could just click on “next entry” and then the title of my report, the date, the speakers AND the feedback-charts would updated automatically
It is also not possible to use charts to display linked table columns separately. For example for my workshop i would like to display two charts one for each question/column of the linked feedback entry “Did you enjoy the workshop from 1 to 5”, and “did you learn something new from 1 to 5” that are linked to the current workshop
Since I cannot use charts to display linked entries columns separately it would be amazing instead to use a javascript script to automatically populate the charts of my report design with the appropriate filters to display only the feedbacks for a specific Workshop
display statistics as pie charts
Create a footer and header similar to the page design plugin
clearly separate multiple pages within my report. Currently while workin on the report i only have one ongoing page, without knowing where the report will be split into multiple pages when exporting as pdf
I had to use chrome instead of safari because on the latter i couldn’t scroll to the bottom of the report
I hope this makes sense. It is very difficult to phrase these issues sensibly. I would be really grateful if some of these issues could be integrated into the report design so that i can easily create great pdf’s of my workshops and their feedbacks as statistics for the workshop-hosts.
”Auto hight“ and “auto expand" can not work together. It is unfixable in the page design plugin. In this year, we have a plan to add another plugin for document/report creation that can work better with float (non-fixed height) elements.
I’ve been exploring the Report Design plugin but can’t find any option for ”Auto hight“ in the table element. Could you confirm if this functionality has been released yet, or if it’s still planned for a future update ?
Pivot tables aren’t currently usable. For some reason you can’t resize past a certain point, and you can’t change the height or width.
Editing a page using the custom field is also broken, changing the dimensions does nothing.
The Heat Map diagram isn’t really a heat map, as you can only select a time series to add counts. It would be more useful if you could change the column from a time series to any “select” category you’d like.
This shouldn’t be a plug-in, but it should be embedded into the Seafile interface like the other views. I would suggest removing the plug-in feature completely and just adding these to the new view types.
@cdb@rdb as much as I’d like to evaluate this very promising plug-in, there’s a big show stopper for our self-hosted installation, so I haven’t even started trying.
Firewall configured to allow traffic on port 6240
(Our) Admins don’t like opening ports left, right and center, for security reasons. That affects me running the server, as well as companies like @Remi ‘s which block certain ports on the client side, possibly though a firewall or a proxy.
Two solutions come to mind:
I realise that I could still use port 443, but a different subdomain for the seadoc-server. However, I’m not sure whether I would run into cross-domain problems.
The seadoc server could run under a dedicated path like https://cloud.seatable.com:443/seadoc/. Any edge router like Caddy, Traefik (which we use), or even the internal Nginx of seatable-server should be OK with it.
Important question for me: Will the seadoc server work under a non-”/” path?
I had some success with this in the past: Some software just deal with it, some can be explicitly configured to work under a path, for some systems, I had success with stripping the path on the edge router - and some softwares just crash. Which one is it?
This just repeats the discussion we had with TLDRAW last year here . The problem in this case is not the server component, but the plugin itself. Ever since then, I have been patching the plugin to work with the /tldraw/ sub-path - works like a dream.
Normally, I would just try it and see (and report) what happens, but I don’t have the time at the moment.
This plugin is really interesting. It feels much easier to use than the Page Design plugin, and for structuring professionnal documents, it seems much more suitable.
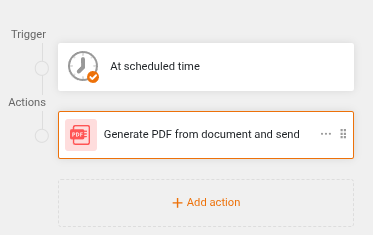
Do you know if an integration with the button field is planned, so that a report can be automatically generated as a PDF and saved into a column, similar to what is currently possible with Page Design ?